INTERPIN Help Page
We designed the INTERPIN (INtrinsic TERmination hairPIN) program to predict Intrinsic transcription terminators in bacterial genomes. The INTERPIN database contains predictions on 12745 bacterial genomes. It is the largest collection of predicted intrinsic terminators to date with approximately 25 million hairpins.
Through the INTERPIN algorithm, we have found effective transcription termination units where the contiguous (within a distance of 14 bases) hairpins group together to form cluster hairpins. Here two or more hairpins work in tandem to cause termination and might even have higher efficiency than the sum of individual termination efficiencies.
In the database, the bacterial genomes have been organized into respective phyla or can be searched by their name as well as NCBI ID. In each prediction for a bacteria, the users can gain information on the predicted operons, frequency of cluster and single hairpins and their distance from the stop codon. Raw information about all hairpin predictions including their location, energies etc. can also be downloaded.
To aid the visualization of hairpins, an IGV visualizer has been added for each genome. Users can view and interact with the predicted hairpins, operons and corresponding gene annotations here. Hairpin secondary and tertiary structures can also be viewed, along with other features.
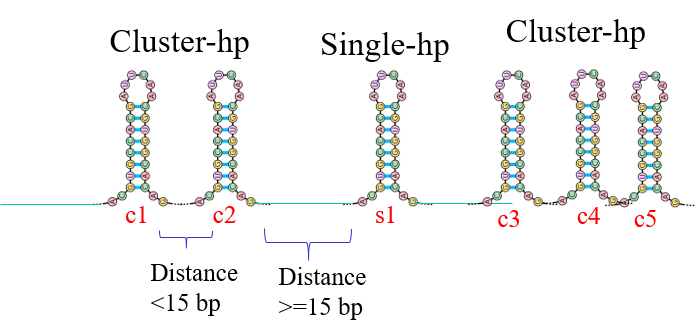
The figure shows the classification of cluster and single hairpins by our algorithm. Hairpins at less than 15 bases from each other are clubbed in a group called the cluster. These hairpins are expected to work together to cause intrinsic termination. The other hairpins lying at larger distances from each other are called single. In the figure above, c1 and c2 form one cluster while c3, c4 and c5 form another. s1 is a single hairpin.
INTERPIN webserver
The webserver is divided into four hyperlinked tabs (see the navigation bar below):
NAVIGATION BAR

- Home page
- Phyla page - To search for desired bacteria based on phyla
- NCBI page - To search for desired bacteria based on NCBI ID
- Help page - Contains detailed information and steps of using the INTERPIN webserver and contact details.
HOME PAGE
- The home page introduces the INTERPIN algorithm and lists various utilities available in the webserver, the details to which can be seen in this document.
- Key information displayed on the home page
- The total number of unique bacteria strains, predicted RNA hairpin and phyla studied using the INTERPIN algorithm.
- Github Link (coming soon)
- Revolving globe displaying live data of users online on the website (user location - city and state name is pointed on the globe)
RESULTS
Obtaining hairpin terminator predictions
NOTE: Prediction results for bacteria can be viewed by two ways
- Choose Phyla for bacteria of interest (PHYLA page)
- Enter NCBI ID for bacteria of interest (NCBI page)
PHYLA PAGE
Classification is a way to group similar organisms and describe the diversity of bacterial species. Bacteria have been classified on different parameters including cell structure, metabolism, shape etc. Phyla-based classification is a taxonomic classification.
We have grouped all analyzed bacteria into respective phylum. Here, the Phyla page displays Phylum/ Class names as buttons that can be selected to show and select all contained bacterial species in that phylum. A phylogenetic tree is also shown below the buttons.
A phylogenetic tree or evolutionary tree is a way of showing the evolutionary relationship among various biological species or other entities based on similarities and differences in their genetic or physical characters. It helps us see how species / groups evolved from a common ancestor and in what order they diverged. One can calculate how much related two species are using distances from the tree.
The phylogenetic tree displayed here shows the phylogenetic tree of phyla taken in our study consists of 9 phyla and 6 classes belonging to phylum proteobacteria. These include Firmicutes, Chlamydiae, Actinobacteria, Planctomycetes, Spirochaetes, Fusobacteria, Cyanobacteria, Thermodesulfobacteria, Acidobacteria, Proteobacteria (Alphaproteobacteria, Betaproteobacteria, Gammaproteobacteria, Deltaproteobacteria, Epsilonproteobacteria, Other proteobacteria). Under each phylum, the total number of bacterial species under that phylum that are presently stored in our webserver is shown.
Given below are the steps to retrieve terminators for a bacterium if its phylum is known.
- Click the phylum/class name of your desired bacteria from the buttons provided.
- Upon clicking a phylum, it will take you to a new page to choose the desired bacteria.
- On the new page displayed, there are two options
- Enter bacteria name in the search box. Once you start typing, possible bacteria names appear based on bacteria available in our database.
- Alternatively, hyperlinks to all bacteria in the phyla are also listed on the page in two columns (as shown below for phylum Gammaproteobacteria). Select the desired bacteria.
- The results page for selected bacteria is displayed. See the result section below for more details.

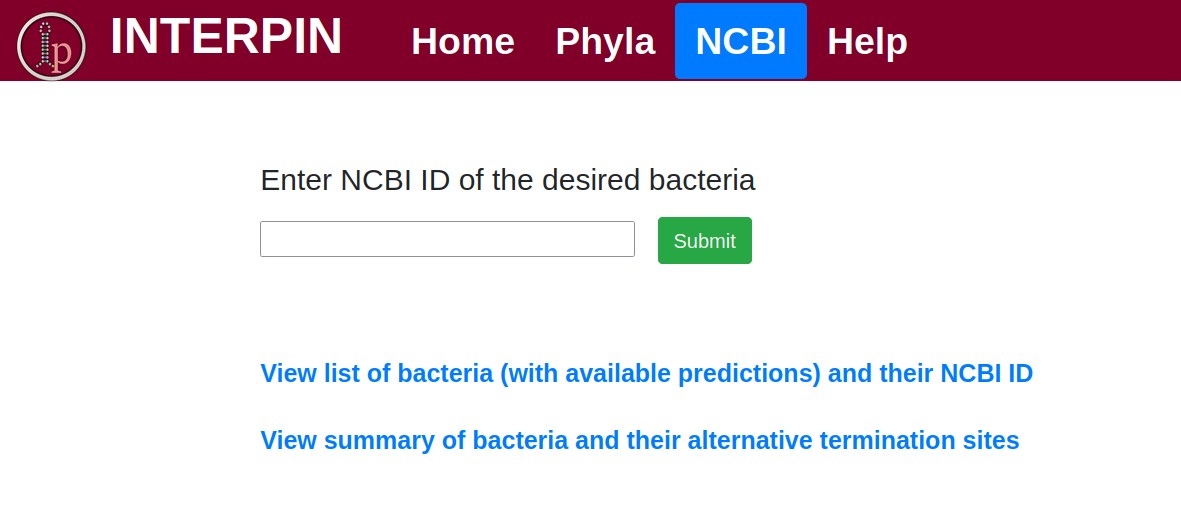
NCBI PAGE
NCBI stands for National Center for Biotechnology Information. The National Center for Biotechnology Information advances science and health by providing access to biomedical and genomic information. The NCBI houses a series of databases relevant to biotechnology and biomedicine and is an important resource for bioinformatics tools and services (https://www.ncbi.nlm.nih.gov/).
All sequences deposited in the NCBI database have a unique sequence identifier. Users can use this unique sequence identifier to retrieve terminators for a bacterium, as given below.
- Enter NCBI ID of desired bacteria in the search box and submit.
- A hyperlink consisting of the tabular output of list of all pre-processed bacteria in the database and their corresponding phylum and NCBI ID is also available for your reference, below the search box, to check for NCBI ID.
- A hyperlink consisting of tabular output of summary for alternate termination sites predicted across all bacterial genomes. The '#Alternate sites' shows the number of termination sites followed by the frequency of such number of predictions in a genome.
- Results page for selected bacteria via NCBI ID is displayed. See the predictions section below for more.
PREDICTIONS
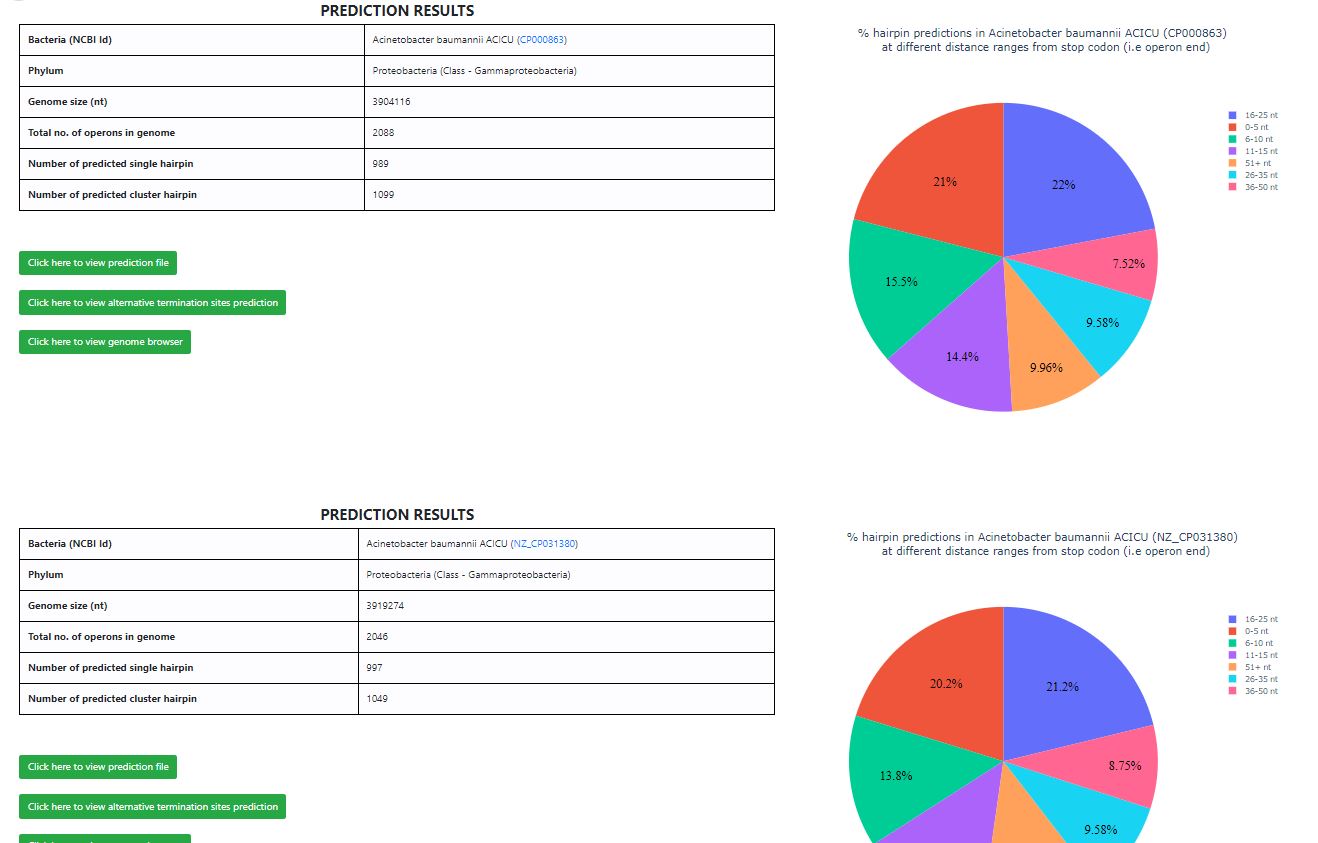
In this section, we explain the format of results displayed on selecting a bacterium. The page shows a ‘PREDICTION RESULTS’ table, which summarizes the terminator hairpins predicted in each bacterium. Shown below are results from ‘Bordetella pertussis I669’.
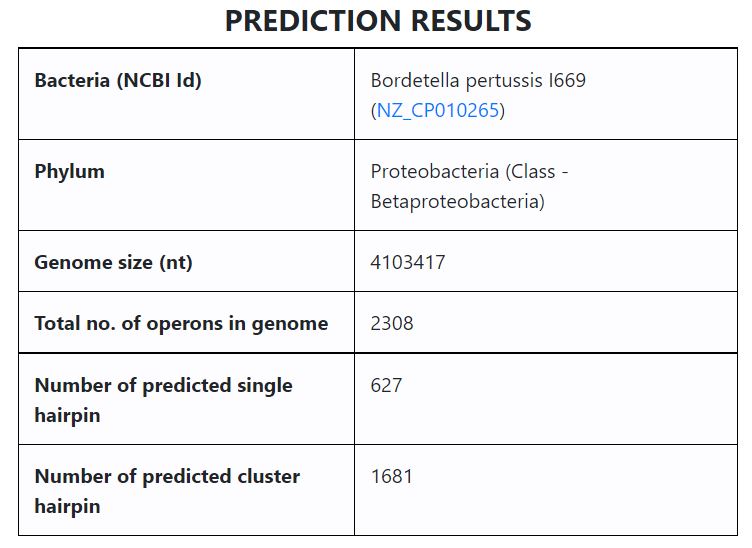
- The tabular output above shows the following data
- Bacteria name and NCBI ID (linked to corresponding page in NCBI website)
- Phylum
- Genome size (in nucleotides, nt)
- % GC content
- Number of operons in the genome
- Number of predicted single hairpin
- Number of predicted cluster hairpin
- Pie chart
- The figure is an interactive pie chart displaying the distribution of predicted hairpins in Bordetella pertussis I669 (NZ_CP010265) located at different distance ranges from stop codon (i.e operon end). This helps in understanding where the majority of the predictions lie from the operon end.
- Hover pointer/ mouse over each sector to see its label (hairpin distance / hp-distance from operon end, and total prediction number falling in that distance range)
- The bin sizes for the distance shown in the pie chart: 0-5 nt, 6-10 nt, 11-15 nt, 16-25 nt, 26-35 nt, 36-50 nt, above 50 nt. (nt- nucleotides)
- Download plot as png option available - Hover cursor on pie title or pie and camera icon appears on the top right corner. Click on it and save in the desired location
- When a bacterium is chosen through NCBI ID, results generated will always contain a prediction of that specific bacteria (one table, one pie chart, link to download prediction file, link to IGV) as shown above.
- However, some bacteria have multiple sequences deposited in NCBI. They still have unique NCBI ID, but the same bacterium name, eg. Acinetobacter baumannii ACICU CP000863 Acinetobacter baumannii ACICU NZ_CP031380
- In such a scenario, when the bacterium is chosen through the PHYLA page, results of all predictions associated with that bacterium’s name, are displayed (multiple results displayed on the same page). See an example below.
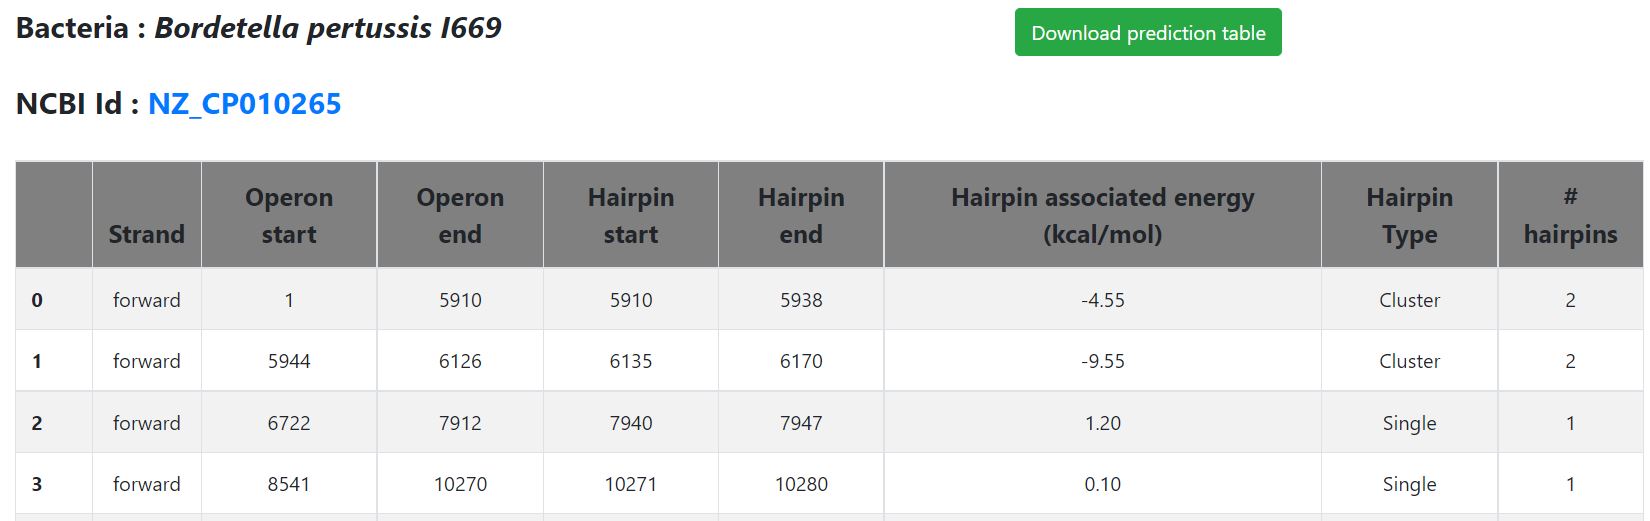
- Hyperlink to view prediction file
- Prediction results can be viewed by clicking on the button available on the results page ('Click here to view prediction file')
- A new page appears with the prediction results data in a tabular format
- The columns of the prediction table are summarized below in the form of Column number – Content type
- 1 – Hairpin predicted on which strand type (forward, reverse)
- 2 - Operon start position in the genome
- 3 - Operon end position in the genome
- 4 - Hairpin start position in the genome
- 5 - Hairpin end position in the genome
- 6 - Hairpin associated energy
- 7 - Type of hairpin (Cluster, Single)
- 8 - # hairpin (1 for single), else number specified
- Users can also download the prediction file, by clicking the button available at the top of the page. The prediction table displayed will be downloaded in CSV format.
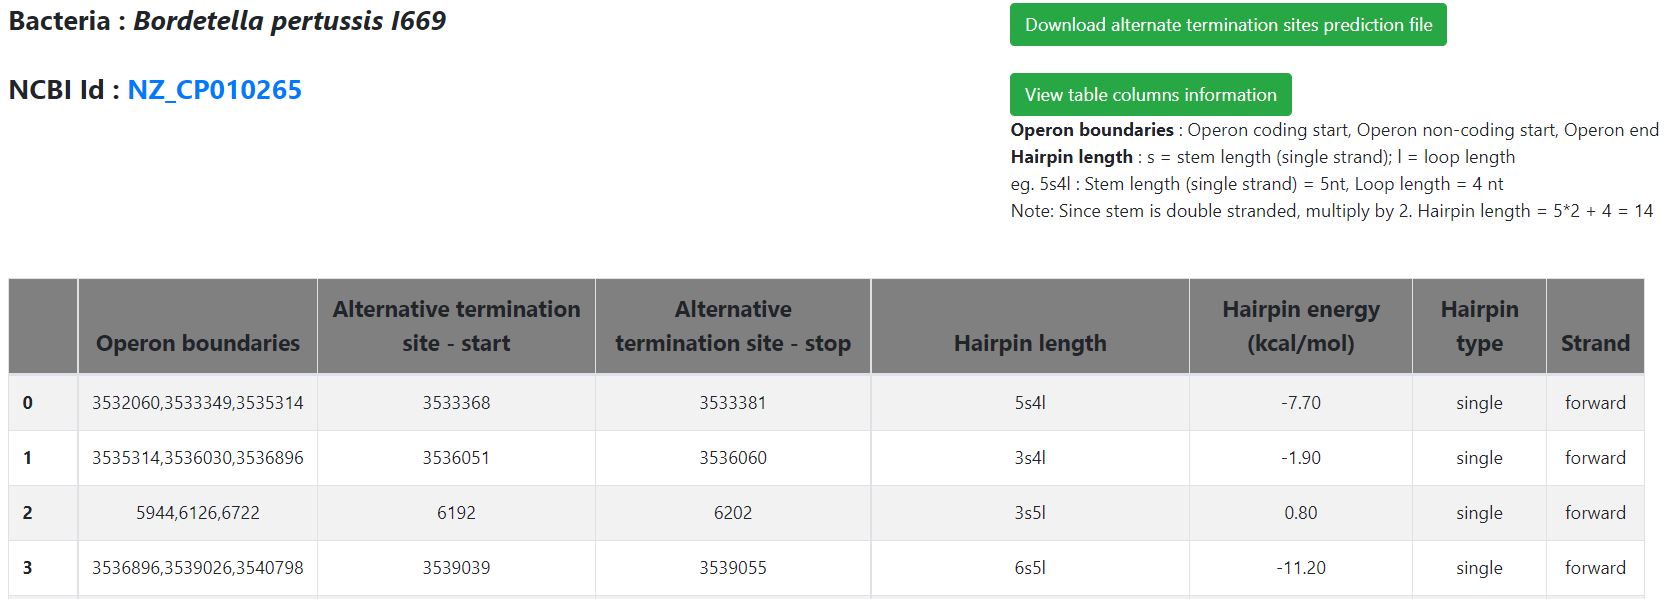
- Hyperlink to view alternate prediction file
- Alternative termination site prediction results can be viewed by clicking on the button available on the results page ('Click here to view alternative termination sites prediction file')
- A new page appears with the prediction results data in a tabular format
- The columns of the prediction table are summarized below in the form of Column number – Content type
- 1- Operon boundary (operon start, operon non-coding region end, operon end); for operons with more than one alternate termination site, separate rows show the predicted sites individually
- 2- Alternate termination site start
- 3- Alternate termination site end
- 4- Hairpin length- stem length (one side) followed by loop length eg. 5s4l, so total hairpin length will be 5*2+4=14. For cluster hairpin, lengths of all constituent hairpin are given and the reported energy is the average energy of constituent hairpins.
- 5- Hairpin energy (in Kcal/mol)
- 6- Hairpin type(cluster, single)
- 7- Hairpin predicted on which strand type (forward, reverse)
- Users can also download the prediction file, by clicking the button available at the top of the page. The prediction table displayed will be downloaded in CSV format.
- Link to genome Browser (IGV)
IGV or the Integrative Genomics Viewer is a widely used interactive tool for the visualization of genomic data in the context of a reference genome. One can view sequences, alignments, annotations inside the IGV tool. More information can be found on its webpage. (https://software.broadinstitute.org/software/igv/ ).
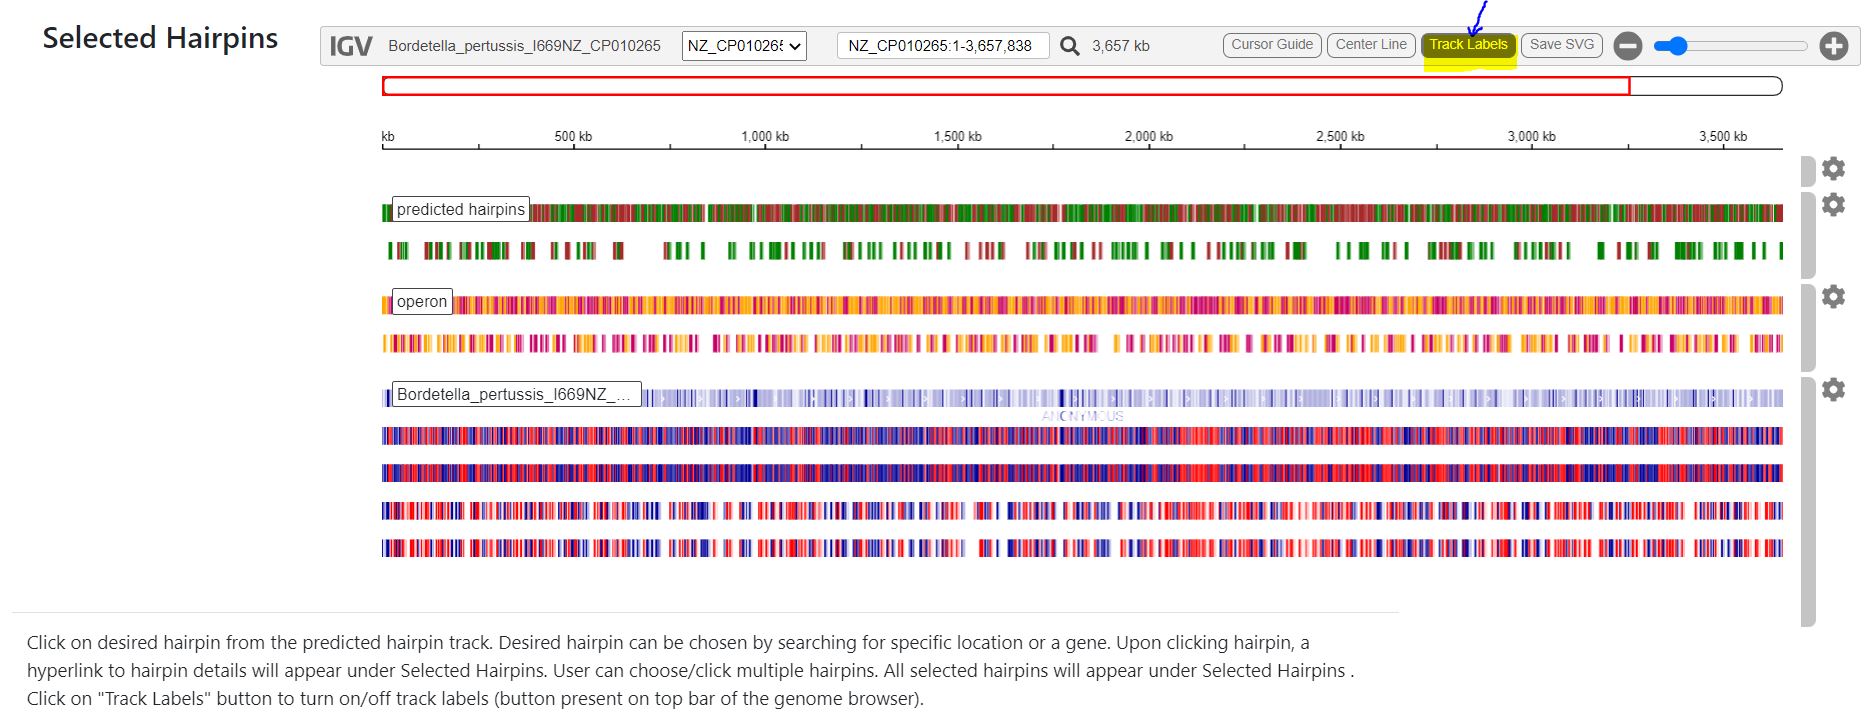
We have integrated the tool into the INTERPIN webserver to enable users to view hairpin predictions, operons, gene annotations of all analyzed bacterial genomes with respect to location on the genome. Below is an example of what all features can be used in the viewer: - Track information
- Hairpin track (all hp) - This track contains predicted terminator hairpins at the predicted location in the genomes. This is shown in green and maroon color.
- Operon track (operon) - This track contains the operons at their location in the genomes. It helps in correlating the position of the hairpin with respect to the operon end. This is shown in yellow and red color
- Annotation track (Bordetella_pertussis_I669NZ_CP010265)- This track displays gene annotations and other genomic features available in gff files of the bacteria. It helps in understanding the terminator hairpin locations with respect to the gene. This is shown in blue and red.
- Color coding using in the tracks is described in the legend below
- Tracks can be zoomed into using (+ / - symbol) or clicking and dragging across the reference line containing size.
- Clicking any element from any track gives its name, location and gene information (for annotation track only).
- There are two ways to search for a location of choice by using the below box.
- Search using location - Enter location coordinates in the box, to reload the tracks at the desired location within the genome. The locations should be input in this format: Id (already displayed in the search box): location range eg. CP010265: 1-20000; the selected range is zoomed into.
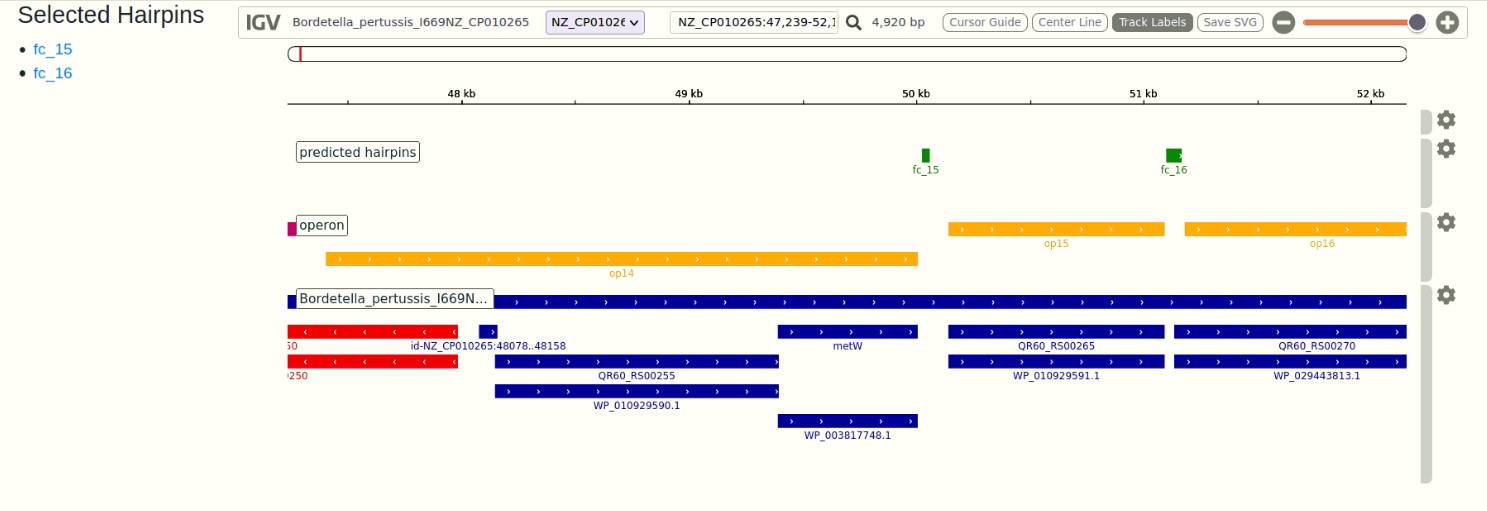
- Search using gene of interest - Users can enter gene of interest (eg. metW) and click the search icon. The genome browser reloads by zooming into the track at gene location
- To get more detailed information like the 2D and 3D structure of any desired hairpin, it can be clicked from the ‘allhp’ track. All selected hairpins will appear with ID (eg. fc_12) on the right pane under ‘Selected Hairpins’
- Click on the hyperlink to see more details pertaining to the 2D and 3D structures of the hairpin.
Note: Operons have been found using the Molquest program (http://molquest.com/), with additions of missing regions from NCBI. For more information see our publication [ref]
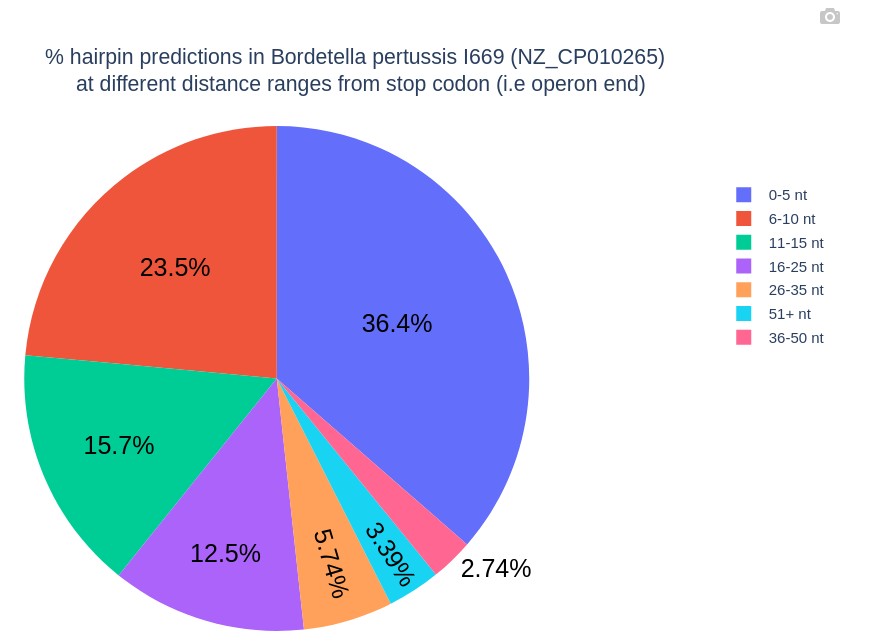
In the pie chart above, 36.4% of hairpins lie at 0-5 nt distance from the stop codon, 23.5% of hairpins lie at 6-10 nt distance and so on.
NOTE:
Integrated Genome Viewer (IGV) loaded with 3 tracks displayed - predicted hairpin track, operon track and genome annotation track
IGV searched by gene name - metW; fc_15 and fc_16 are clicked from track for further analysis. fc_15 and fc_16 appear under Selected Hairpins
Integrated Genome Viewer (IGV) is displayed with three loaded tracks. The names of the tracks can be toggled on/off by the "Track Label" button on top right side of the window.

HAIRPIN information obtained upon clicking hairpin link on IGV page
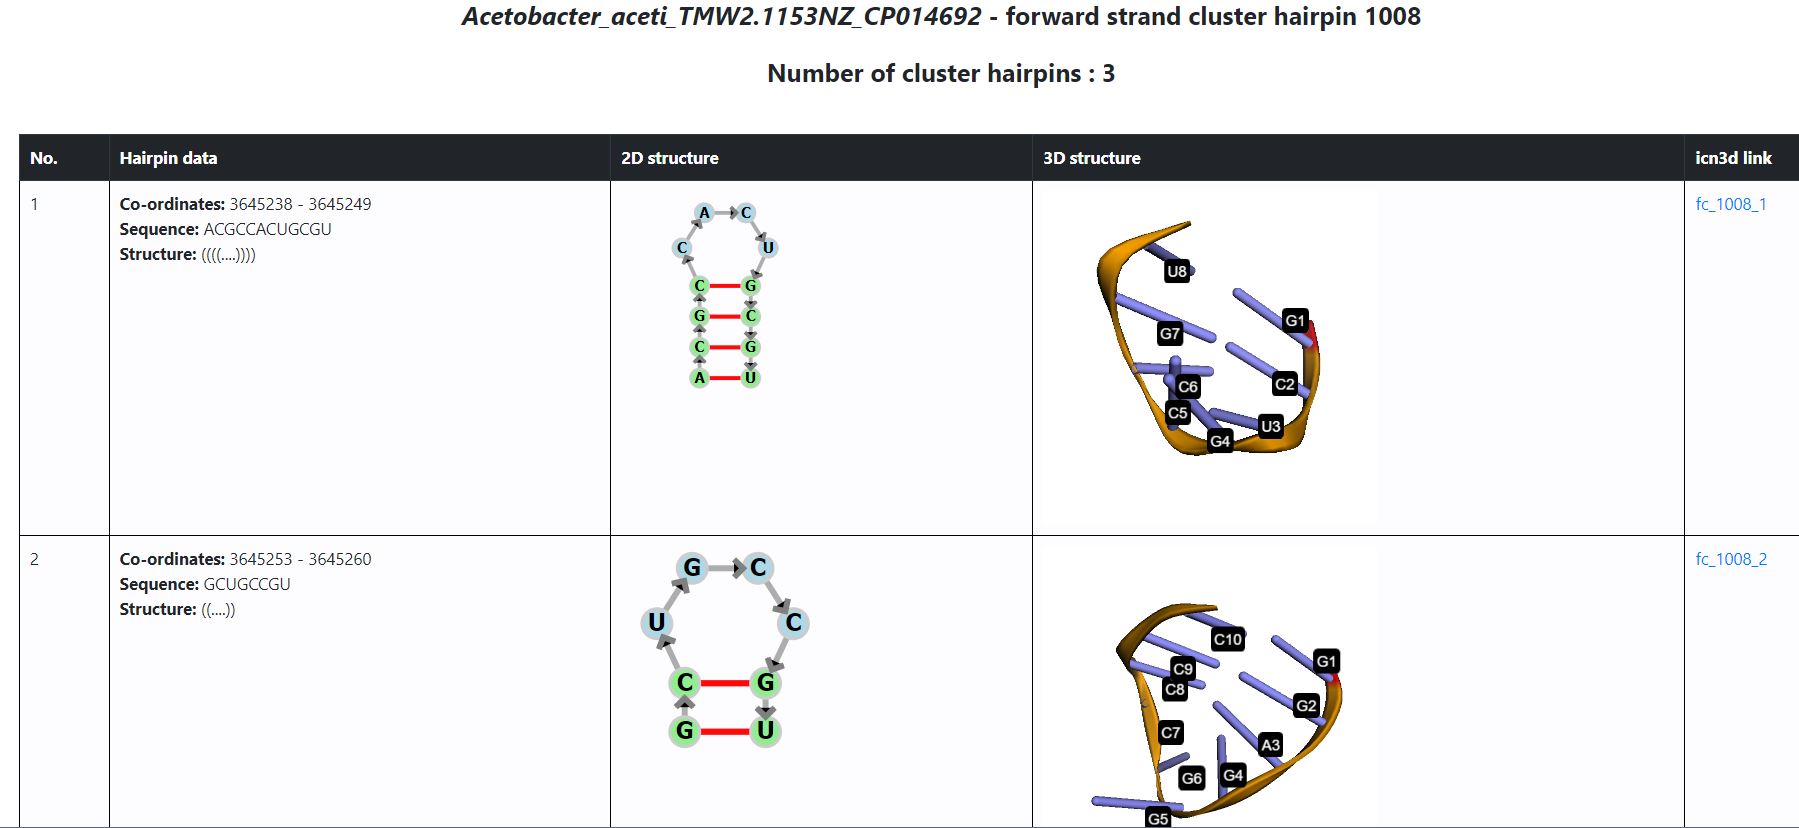
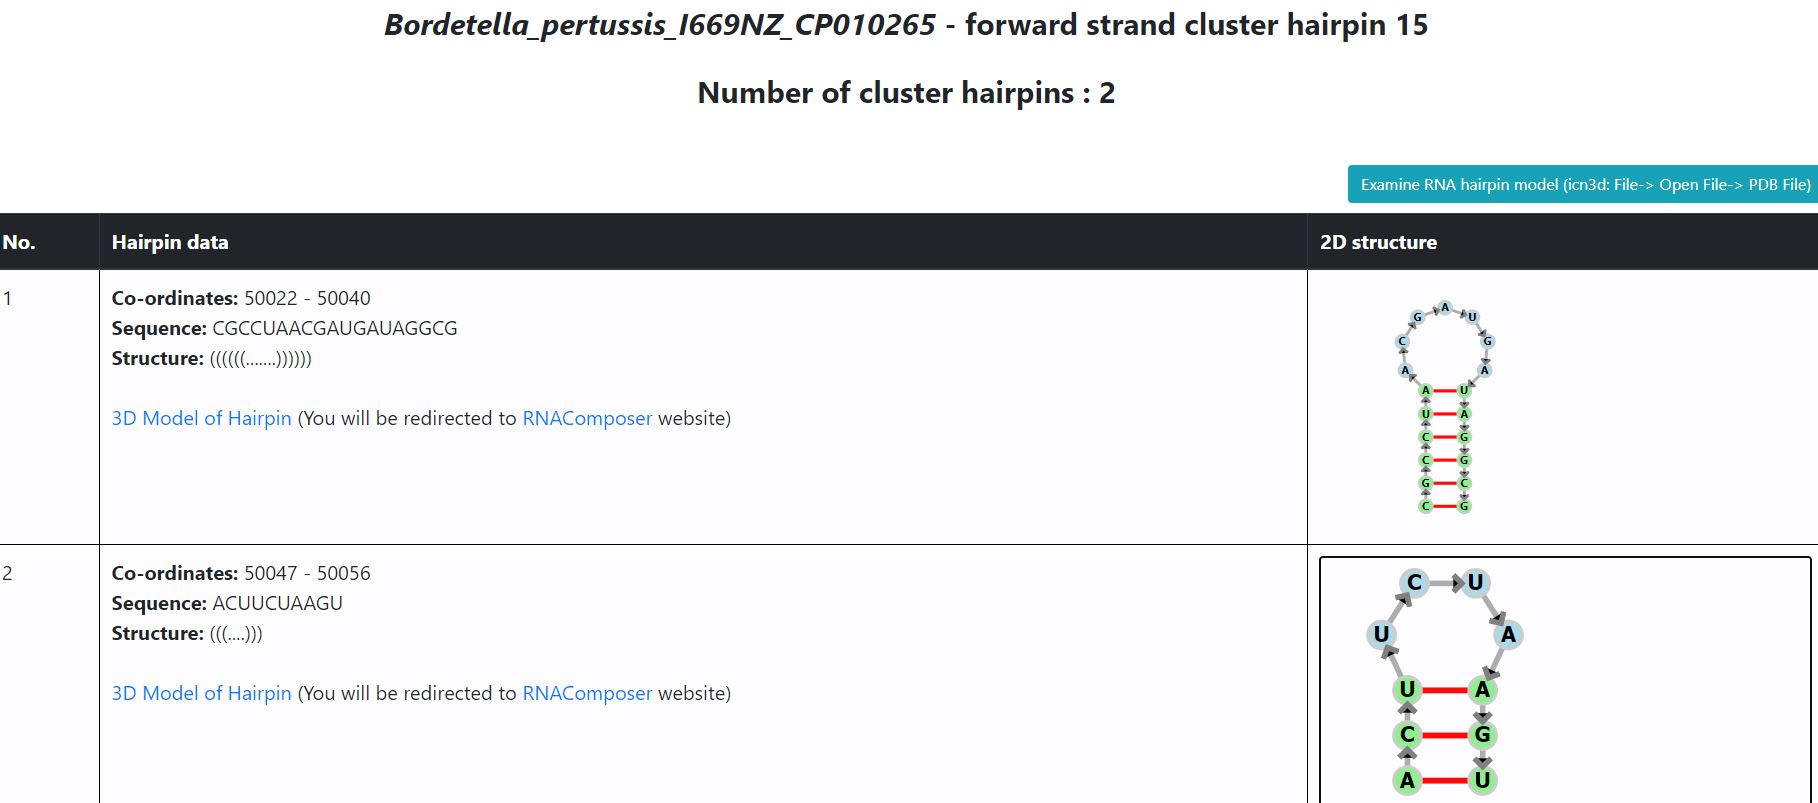
- The displayed page now shows: Name of the bacterium, type of hairpin prediction (strand, cluster/single), number of cluster hairpins (in case of cluster hp) is displayed. An example is shown below: Note: All hairpins inside a cluster are displayed one below the other in order of occurrence in the cluster.
- Hairpin information is summarized in a tabular form as seen in the image above
- Hairpin information is summarized in a tabular form as seen in the image above
- 2D structure is generated from the dot-bracket format using fornac (https://github.com/ViennaRNA/fornac). This is shown in the second column.
- 3D structure with residues labeled, generated using 3dmol.js (https://3dmol.csb.pitt.edu/). The nucleotides are labelled by residue number
- The last column links to icn3D, an interactive web-based viewer for 3D structures. It provides several features to explore the 3D structure of hairpin further. You can read more about it at https://www.ncbi.nlm.nih.gov/Structure/icn3d/icn3d.html#gallery
- The above features are available for following the bacteria - Acetobacter aceti TMW2.1153 NZ_CP014692 (hairpin fc_0, fs_180, fc_444, fs_545, fc_674, fs_820, fc_1008, rc_15, rc_138, rs_379, rs_775, and rs_1056) and Acetobacter ascendens LMG 1590 NZ_CP015164 (hairpin fc_32, fs_166, fc_371, fs_645, fs_804, rc_22, rc_199, rs_281, rs_547, rc_678, and rs_788).
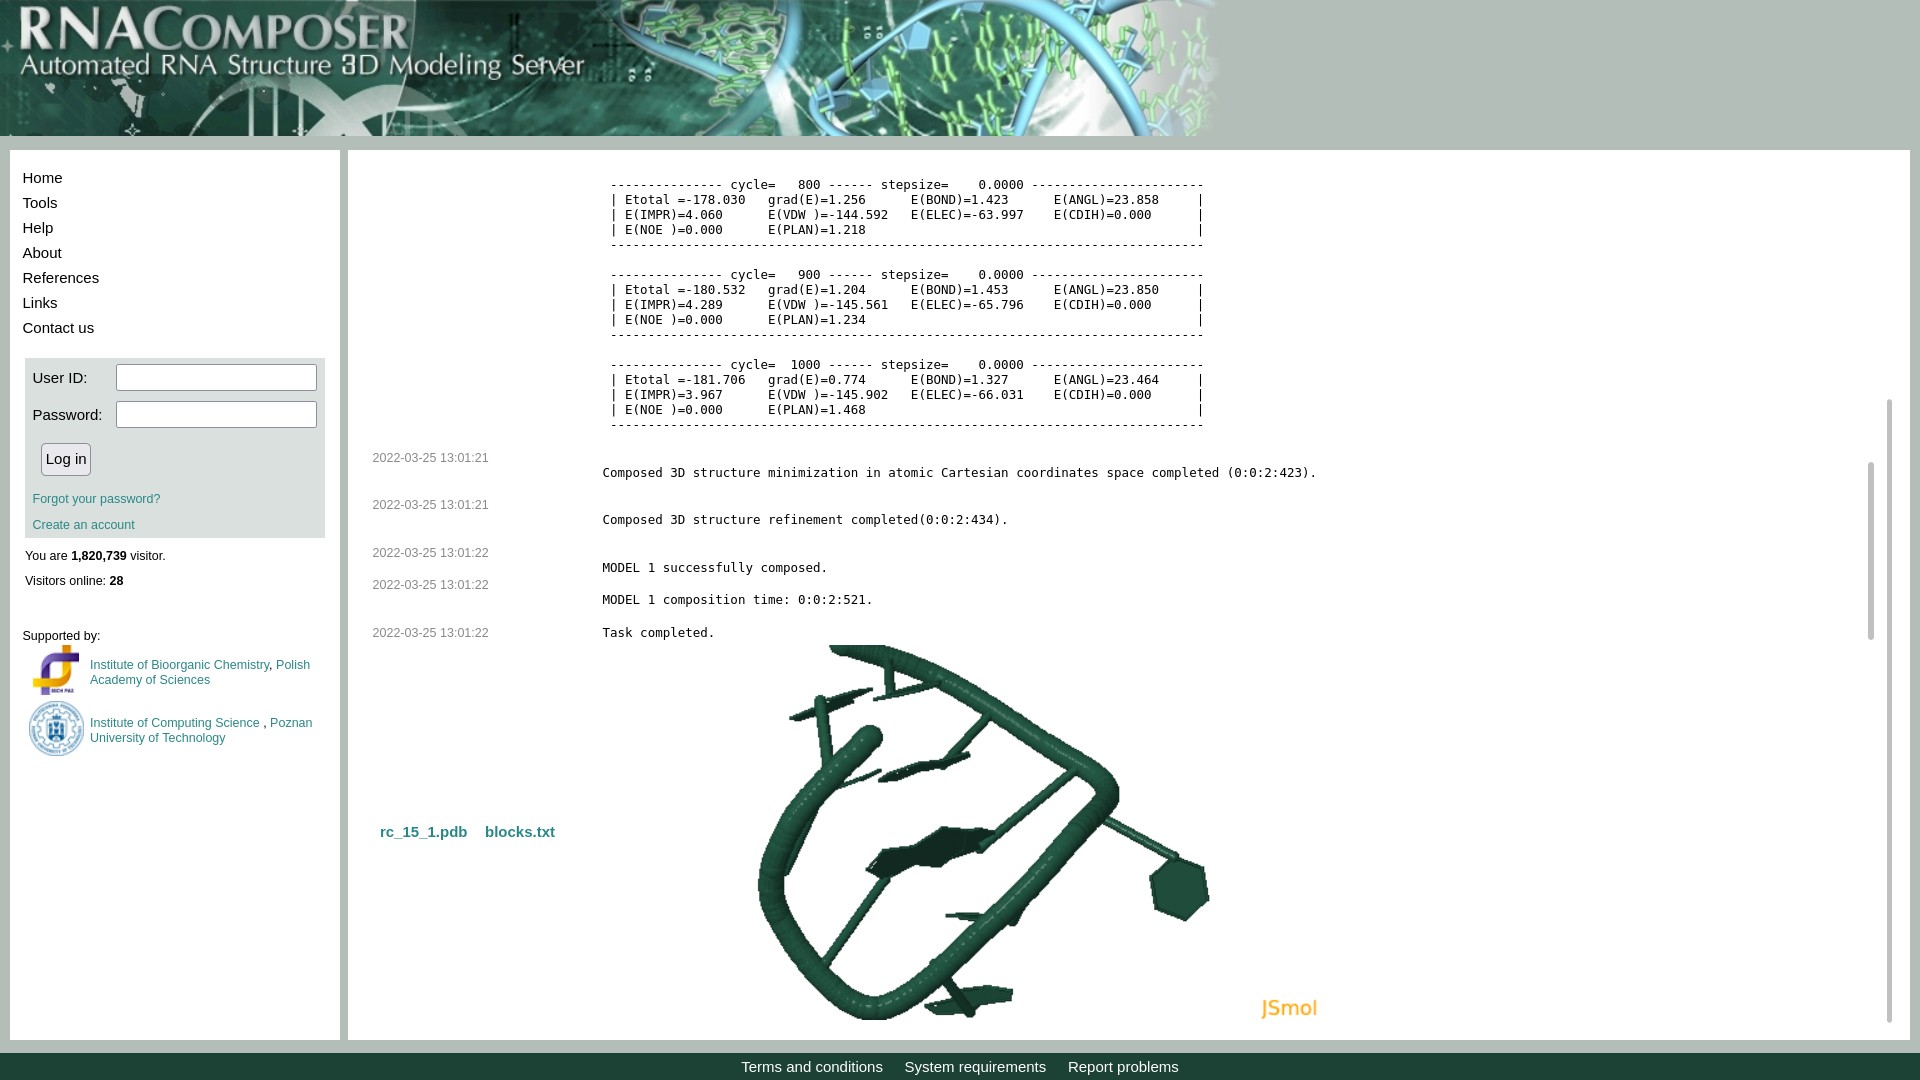
- In case of all other bacteria, hyperlink ("3D model of hairpin") is provided below each hairpin sequence. The hyperlink redirects user to the RNAComposer website where the sequence is pre-loaded and 3D structure is being generated. In case, there are any warnings, users are requested to ignore them and click on Compose button to generate the 3D model. Once the model is generated, the pdb file for the same can be downloaded as highlighted in image below.
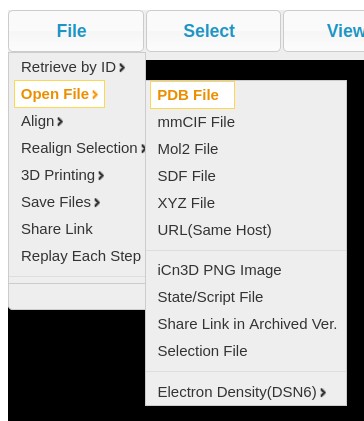
- Users also have an option to analyze the PDB file further using icn3d, for which a button has been provided on the same page. Local PDB files must be loaded in icn3d using the 'File' tab in the top left corner of the icn3d window. The structure of hairpin can be visualised with the various features available in icn3d. The following image describes how to load files in PDB format and visualize using certain features

Click on File -> Open File -> PDB file, to load PDB file downloaded from RNACOMPOSER
Click on Load button and upload the PDB file
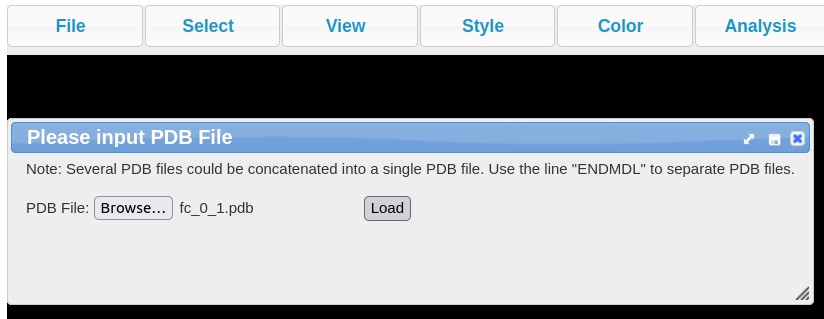
3D structure is displayed